What Is a Time Frame?
When people talk about a time frame in day trading, it’s all about the time-based chart interval. All major trading platforms offer time frames like the daily, weekly, monthly, or even yearly charts. But those time frames have only limited benefits for day traders. As a day trader, you need intraday time frames to time your entries and exits. The intraday time frames allow you to enter trades with an excellent risk-reward ratio.
60-Minute Time Frame
Swing-traders frequently use the 60-Minute time frame, but there is also the potential for profitable day-trades by combining this chart interval with a lower chart interval utilizing multi-time-frame analysis. One thing to keep in mind, the regular trading hours are from 9:30 a.m. to 4:00 p.m., and the first candle starts at 9:30. Therefore, the last 60-minute candle of a day only contains data of the last 30 minutes of the regular trading hours session from 3:30 p.m. to 4:00 p.m.
15-Minute Time Frame
The 15-minute time frame is probably the most popular interval for day traders focusing on multiple stocks throughout the day. The longer the watchlist, the higher the chart interval should be. You need to have a realistic chance to scan and analyze the current market behavior. If the chosen time frame is too low, and too many stock symbols are screened at a time, the chances of missing the best possible entries increases.
5 Minute Time Frame
High volatile stocks move fast, and traders who focus on only a couple of stocks a day use the 5-minute time frame frequently. The 5-minute chart is especially helpful in the first 60 minutes of a trading day. The time per candle is long enough to analyze the stock and to prepare the orders.
1-Minute Time Frame
Trading in short-term time frames such as the 1-minute chart requires discipline and an excellent understanding of the market structure. You need to know what you are looking for. For example if a highly volatile stock breaks the previous day high with high momentum, chances increase that the next higher low in the 1-minute time frame allows you to open a trade with low risk and high potential.
Multi-Time Frame Analysis
Trading against the primary trend is a big trap that new traders fall into. Often, the higher time frames are not considered at all. The right way is to work from the highest time frame to the lower one to spot entries with a high profit potential. If the current price is above the previous day high, above the 60-minute opening range, and with higher lows and higher highs all over the place, the sentiment is bullish. Shorting such stocks is against the trend, and the chances are that a short squeeze will lead right to the next high. The higher time frames determine the trend, and it is the most profitable approach to trade with the trend until it’s broken.

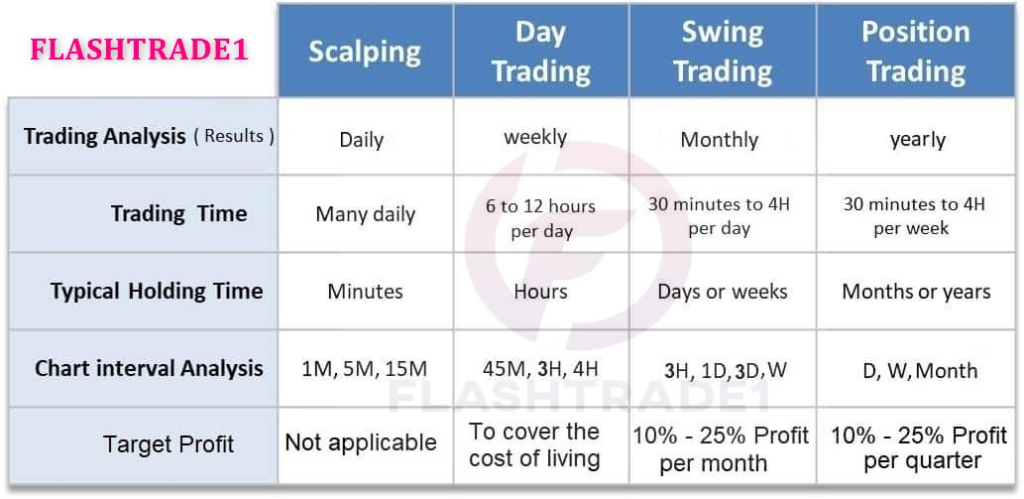
The default stock chart time frame for your chart analysis is based on your type of trading. Daytraders use some intra-day time frame selection based on minutes. Position traders and swing traders use weekly and daily charts i.e. long term charts type.
But whatever style of trading you have, daytrading, swing or position trading, you must analyze more than one type of chart.
Any time you analyze a price chart, you need to see important levels of support or resistance. If you look into one price chart time frame only (say, a daily time frame) and omit others, you are making a big mistake!
There is a solution. Use three different chart time frames for your technical chart analysis.
Your main time frame (like daily)
One time frame with a longer scale (like weekly)
One time frame with a shorter scale (like hourly or four hours)
It is important to check more time frames on your charts
There are two reasons for checking more than one time frame on stock charts:
You will see important support and resistance levels on a larger scale than your basic one.
A smaller time frame will help you fine-tune your entry point and stop loss level for your trade.
So what is typical time frame used by successful traders?
Daytraders
Basic charts …. 15min , 30 min, hourly
Longer one … 240 min (4hours), daily
Shorter one … 5min , 15 min
Swing traders
Basic charts …. daily
Longer one … weekly
Shorter one … hourly or 240 minute (4 hours)
Position traders:
Basic charts …. weekly
Longer one … monthly
Shorter one … daily or 240 minute (4 hours)
WHERE TO CONTACT US:
Website: www.flashtrade1.com
Twitter: twitter.com/flashtrade11
Telegram: telegram.me/ft113
Facebook: www.facebook.com/FlashTrade1
Instagram: www.instagram.com/flashtrade1/
You Tube: www.youtube.com/FlashTrade1
Skype: flashtrade1@outlook.com
Mail ID: info.flashtrade@gmail.com